Classwork |
 |
|
 |
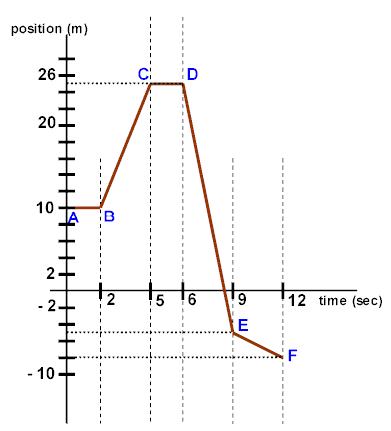
Convert the position-time graph shown to the right to a velocity-time graph. Next calculate the total distance traveled, the net displacement, the average speed and the average velocity for the entire 12 seconds illustrated. |
 |
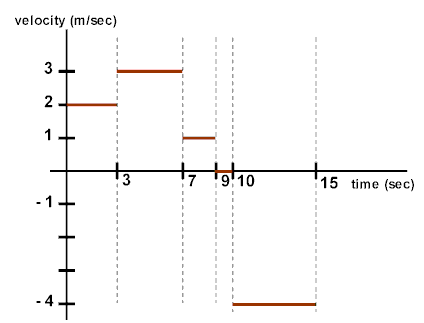
Convert the velocity-time graph shown to the left to a position-time graph. Next calculate the total distance traveled, the net displacement, the average speed and the average velocity for the entire 15 seconds illustrated. |
Copyright © 1997-2002
Catharine H. Colwell
All rights reserved.
PhysicsLAB